
 The State Government plans to spend $18 billion on WestConnex, an inner city tollway that is to connect the M4 to the M5 via a tunnel. The tunnel will be one of the world’s longest, and most expensive. The $18 billion bill for WestConnex dwarfs spending on other forms of transport infrastructure. As an example, the chronically underfunded Western Sydney Infrastructure Plan and Fixing Country Roads program have a combined budget of only $7 billion over the next 10 years.
The WestConnex Strategic Business Case was released on 20 November 2015. It contains high-level numbers, but only some of the assumptions behind them. It claims that, in today’s dollars, WestConnex will cost $13.5 billion and deliver $21 billion worth of benefits. But a look at the detail shows a different picture.
Of the $21 billion worth of benefits, $13 billion are ‘travel time’ savings, the dollar value of the time saved by users of WestConnex over all the different sections of road that will make up the whole WestConnex.
The strategic business case does not say how much time each user will save, or how many users there will be. But it does include sample trips from which we can tell approximately how many minutes each section of the WestConnex will save users, and the business case does say how many vehicles are expected to use each section by 2031. With these numbers we can work out that WestConnex users are expected to save up to 45,000 hours a day.
The strategic business case includes estimates of the value of one hour to five different types of users (commuters, light commercial vehicles, heavy commercial vehicles, business and other). The average is $38.67 per hour, giving the 45,000 hours to be saved in 2031 a value of $630 million – but remember that a dollar now is worth more than a dollar in 15 years’ time. The business case warns that benefits will be lower in years prior to 2031, and much lower in the years between now and 2023, when the final stage is scheduled to open.
If $630 million of travel time benefit were to be delivered in each of the 46 years between 2023 and 2051, then the total benefit might be as high as $18 billion. However, the business case claims that the total travel time benefits will be $55 billion, three times what the numbers in the business case actually indicate. On the numbers, there will be a shortfall of $37 billion. In today’s money, this represents a shortfall of $8.1 billion in benefits.
Benefits are not the same thing as revenue but the two are closely related. The lower the benefits, the lower the revenue. The private sector will be paid to build WestConnex but any shortfall in revenue will ultimately be covered by taxpayers. An $8 billion hole will mean painful tax rises or cuts to other spending, either through less spending on other roads, on other government services, or through tax increases.
If benefits other than travel time saving are also overstated, or if traffic projections are optimistic, or if the value of saving an hour is less than $38.67, or if the cost of building and operating WestConnex blows out, then the resulting hole in the NSW State budget will be higher than $8 billion.
While there is the option of increasing tolls by more than currently planned, this is unlikely to help. Commuters are already expected to pay more than $10 each way, to save between 5 and 15 minutes. Tolls are already planned to rise at 4% per year. By 2039, the toll will reach $20 each way. Some lane closures are planned, to ‘encourage’ commuters to use the tollway, but higher tolls would still reduce the number of people using WestConnex, making the shortfall larger, not smaller.
Tunnels are incredibly expensive, and commuters are hardly flush with spare cash. Brisbane’s Airport Tunnel, the Clem 7 tunnel, EastLink Melbourne, Sydney’s Cross City Tunnel, and the Lane Cove Tunnel have all been financial disasters. The strategic business case fails to demonstrate that WestConnex will be different. The benefits are dubious but the risks are real. The onus is now on Mike Baird and his Government to explain how they will protect the taxpayer and the budget.
The Australian National Audit Office is considering auditing the WestConnex business case. The strategic businesses case demonstrates the urgent need for such an audit. Taxpayers of NSW and Australia deserve accountability in how their money is spent.
The WestConnex Strategic Business Case can be found here:
It has four supporting documents, available at the same address:
- Technical Paper 1 – Traffic Report
- Technical Paper 2 – Economic Appraisal
- Technical Paper 3 – Update to Strategic Environmental Review
- Technical Paper 4 – Communication and Stakeholder Engagement Timeline
The following figures are all from Technical Paper 2. 1
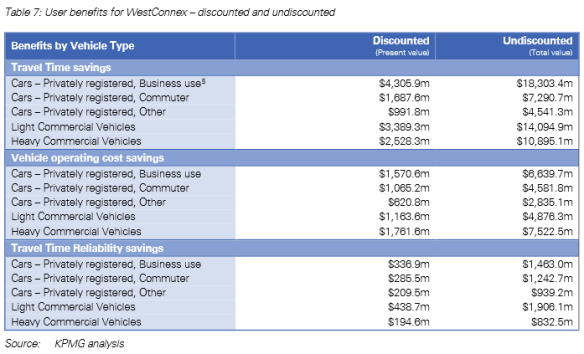
The Economic Appraisal claims that, at present value, WestConnex will cost $13.5 billion and will deliver $22.2 billion in benefits, of which $12.9 billion are ‘travel time savings’. Another $6.2 billion of claimed benefits are reduced ‘vehicle operating costs’, and another $1.5 billion are ‘reliability benefits’. There are another $1.65 billion of ‘non-user benefits’.
All of the claimed benefits result from the claimed reduction in congestion.
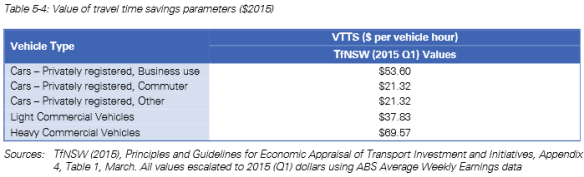
Time saving per vehicle is not directly provided, but estimates of the ‘value of travel time saving’ to each class of vehicle are provided.
Dividing the total value by the value per hour gives us an estimate of the total hours expected to be saved over the evaluation period (34 years – 2019 to 2052).
| $M present value |
$M total |
$ per hour | Total hours (Millions) |
|
| business | 4305.9 | 18303.4 | 53.6 | 341.481 |
| commuter | 1687.6 | 7290.7 | 21.32 | 341.965 |
| other | 991.8 | 4541.3 | 21.32 | 213.007 |
| lcv | 3389.3 | 14094.9 | 37.83 | 372.585 |
| hcv | 2528.3 | 10895.1 | 69.57 | 156.606 |
| total | 12902.9 | 55125.4 | 1425.645 |
Dividing the total hours into the total dollars shows that the forecast average benefit per hour is $38.67. 2
1.425 billion hours over 34 years is about 137,000 hours per weekday (assuming commuter and business trips are Monday to Friday, and all other trips are evenly spread over the week, and that all weeks are equal).
| Total hours (Millions) | Days/Year | Hours /Day | |
| business | 341.481 | 260 | 38,629 |
| commuter | 341.965 | 260 | 38,684 |
| other | 213.007 | 365 | 17,164 |
| lcv | 372.585 | 365 | 30,023 |
| hcv | 156.606 | 365 | 12,619 |
| total | 1425.645 | 137,119 |
The forecast number of vehicles using each section of the road is as follows:
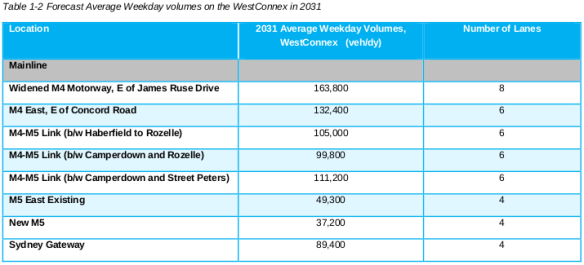
The total number of sections travelled is 788,100. (This is higher than the total number of trips because most trips traverse multiple sections.)
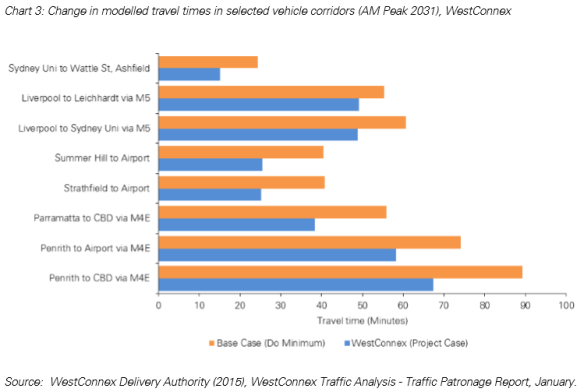
Chart 3 shows claimed time savings per vehicle for selected trips.
 If we map the trips, we get the following:

We can read the data off the chart, and the number of sections off the map, and we see that the expected time with and without WestConnex is as follows:
|
Selected Trips |
Without WestConnex |
With WestConnex |
Minutes saved |
Sections traversed |
Saving per section |
|
Sydney University to Wattle St, Ashfield |
25 min |
15 min |
10 min |
2 |
5.0 min |
|
Liverpool to Leichardt |
55 min |
49 min |
6 min |
4 |
1.5 min |
|
Liverpool to Sydney University |
61 min |
49 min |
12 min |
4 |
3.0 min |
|
Summer Hill to Airport |
41 min |
26 min |
15 min |
5 |
3.0 min |
|
Strathfield to Airport |
41 min |
25 min |
16 min |
5 |
3.2 min |
|
Parramatta to CBD |
46 min |
38 min |
8 min |
3 |
2.7 min |
|
Penrith to Airport |
74 min |
58 min |
16 min |
4 |
4.0 min |
|
Penrith to CBD |
89 min |
67 min |
22 min |
4 |
5.5 min |
|
Average |
54.0 min |
40.9 min |
13.1 min |
3.88 |
3.39 min |
With this data, we see that the time saving per section is 3.39 minutes, indicating that the travel time saved will be 788,100 * 3.39/60 = 44,490 hours per day. Strictly, this is the value per weekday, but in the absence of information as to what to expect on the weekend, we probably don’t have a better option than to assume that weekdays are reasonably typical of all days. If we use the average value of travel time saved from the strategic business case, then 44,490 hours per day is a benefit of around 627 million dollars a year. It feels a little odd to use a constant value of time, but this is what the business case says, and it is consistent with Transport for NSW Guidelines. Applying an uplift for wage inflation would increase the total benefit by more than it would increase the net present benefit, because in the short term, allowing for an increase in wage inflation makes little difference – it only makes much of a difference towards the end of the evaluation period which has little effect on net present value.
Given that $12.9 billion of the claimed benefits are travel time savings, an error of the order of $8.1 billion is almost 2/3rds of the claimed benefit. Vehicle operating cost benefits, reliability benefits and almost all of the $9.3 billion of other claimed benefits should in theory be proportional to travel time savings, and this indeed is what Figure 5-1 shows. If the other benefits are similarly overstated, then the total user benefits may have been overestimated by up to $14.3 billion, or more.
By way of comparison:
The budget for the Western Sydney Infrastructure Plan is $2.9 billion over 10 years.
The budget for the Fixing Country Roads program is $4 billion, also over 10 years.
In this year’s budget, the State Government has allocated $103.3 million for the Western Sydney Infrastructure Plan.
Over 10 years, the Western Sydney Infrastructure Plan will include:
- an upgrade of The Northern Road to a minimum of four lanes from Narellan to Jamison Road, Penrith;
- construction of a new east-west motorway to the airport between the M7 Motorway and The Northern Road (to be known as the M12 Motorway);
- an upgrade of Bringelly Road to a minimum of four lanes between The Northern Road and Camden Valley Way;
- construction of the Werrington Arterial Road by upgrading Kent Road and Gipps Street to four lanes between the Great Western Highway and the M4 Motorway;
- an upgrade of the intersection of Ross Street and the Great Western Highway; and
- a $200 million package for local roads upgrades, to be delivered across five rounds over ten years.
For 2014-15, $43 million was spent under the Fixing Country Roads program. For 2015-2016, $50 million was made available to the 109 regional councils eligible for funding under the Fixing Country Roads program – less than $500,000 per council. Over 10 years, there is only $4 billion allocated for all of regional NSW.
1 All numbers are Present Value except where indicated otherwise.
A number of the assumptions in the technical paper have been questioned elsewhere, including: traffic volume forecasts, time travel saved, and the value per hour of travel time saved. For the purpose of this analysis, the numbers in the technical paper have been used as presented, if these assumptions are wrong, then the benefits will be even lower than have been estimated here.
2 It may also be worth noting that while business trips are assumed to be almost 24% of all trips; Transport for NSW’s Principles and Guidelines for Economic Appraisal of Transport Investment and Initiatives recommends assuming that 8% to 12% of trips will be business trips. As business trips are much more valuable than average, the expected value of travel time would be between 10% and 13% if the Transport for NSW recommendation were followed.

Pingback: Defining alternatives – what NOT to do – The IES Blog
Pingback: Save Sydney Park – Audit WestConnex! | Alexandria Residents' Action Group
Reblogged this on A People's New M5 EIS and commented:
Every recent Toll Road in Australia has fallen short of expectations. Several have gone dramatically bust. A look at the WestConnex Updated Strategic Business Case suggests that WestConnex will go the same way, and at considerable cost to NSW and Australian taxpayer.
There’s a petition here: https://www.communityrun.org/petitions/audit-westconnex-1
Or you can use ANAO’s ‘contact us’ page: http://www.anao.gov.au/Contact-Us
And possibly best of all, you can contact your local Federal MP – for details see http://www.openaustralia.org.au/ or http://www.australia.gov.au/about-government/contact-government/contact-ministers-members-and-senators
Is there any way to lobby the Australian National Audit Office to actually conduct an audit?